DimReader: Axis Lines that Explain Non-Linear Projections
Published in IEEE Trans. on Visualization and Computer Graphics 25(1) , 2018
Authors: Rebecca Faust, David Glickenstein, Carlos Scheidegger

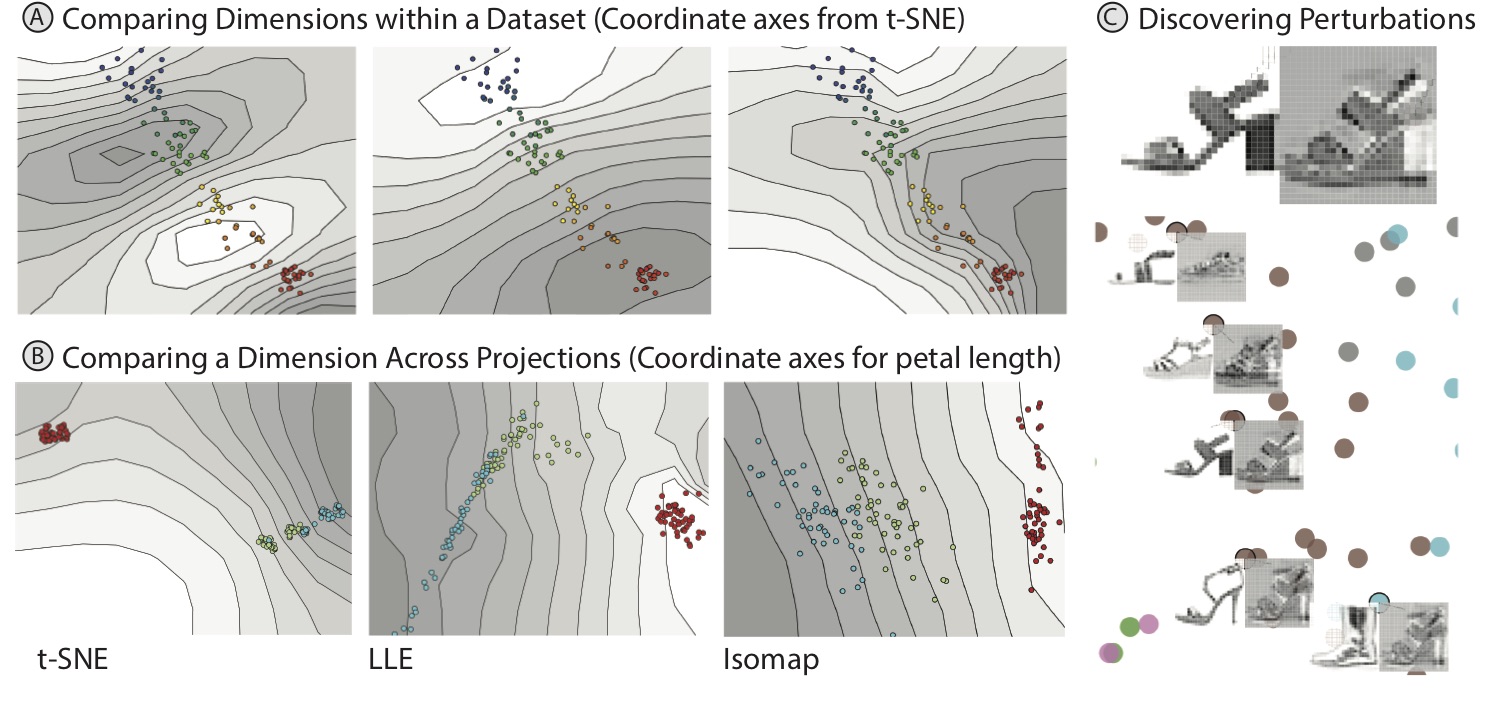
Non-linear dimensionality reduction (NDR) methods such as LLE and t-SNE are popular with visualization researchers and experienced data analysts, but present serious problems of interpretation. In this paper, we present DimReader, a technique that recovers readable axes from such techniques. DimReader is based on analyzing infinitesimal perturbations of the dataset with respect to variables of interest. The perturbations define exactly how we want to change each point in the original dataset and we measure the effect that these changes have on the projection. The recovered axes are in direct analogy with the axis lines (grid lines) of traditional scatterplots.
We also present methods for discovering perturbations on the input data that change the projection the most. The calculation of the perturbations is efficient and easily integrated into programs written in modern programming languages. We present results of DimReader on a variety of NDR methods and datasets both synthetic and real-life, and show how it can be used to compare different NDR methods. Finally, we discuss limitations of our proposal and situations where further research is needed.
Recommended citation: R. Faust, D. Glickenstein, and C. Scheidegger, “DimReader: Axis Lines that Explain Non-Linear Projections,” IEEE Transactions on Visualization and Computer Graphics, vol. 25, no. 1, pp. 481–490, 2019.
