Aardvark: Comparative Visualization of Data Analysis Scripts
Published in Symposium on Visual Data Science at IEEE VIS, 2023
Authors: Rebecca Faust, Carlos Scheidegger, Chris North.
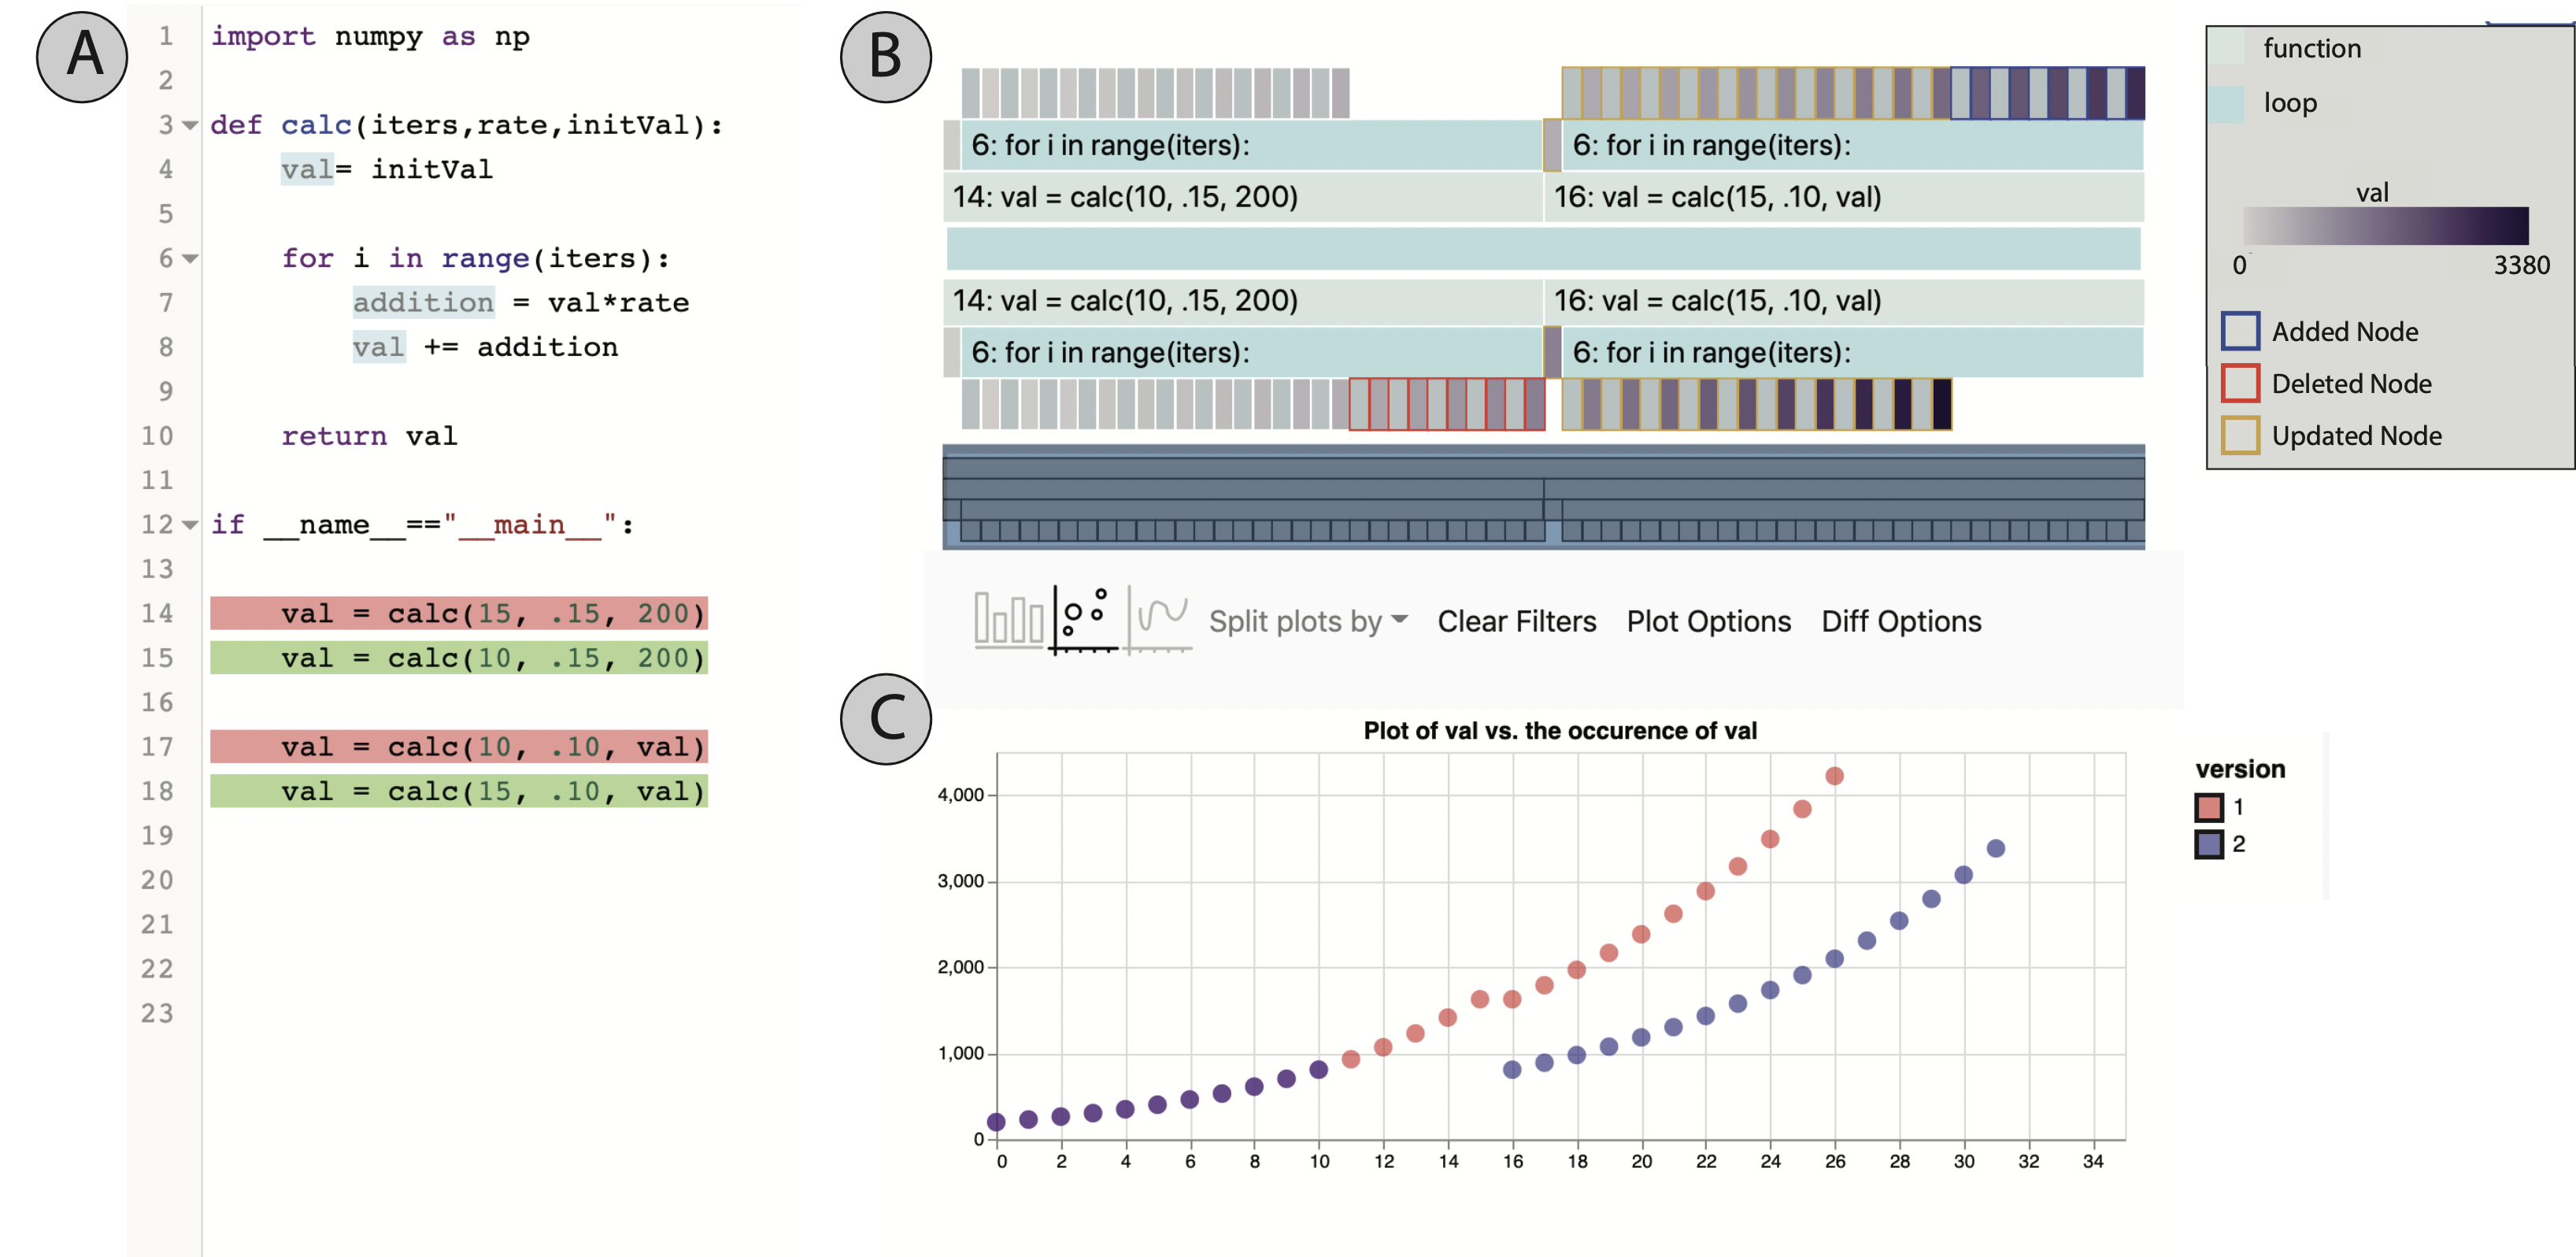
Debugging programs is one of the most challenging and time consuming parts of programming. Data science scripts present additional challenges as debugging often centers around more exploratory tasks, such as understanding the differences between results under different parameter settings. In fact, a common exploratory debugging practice is to run, modify, and re-run a script to observe the effects of the modification. Analysts perform this process frequently as they explore different settings and algorithms in their analysis. However, traditional debugging methods are not well suited to comparing across multiple executions of a script. They often require maintaining two instances of the debugging method and making manual, serial comparisons of program values. To address this gap, we present Aardvark, a comparative trace-based debugging method for identifying and visualizing the differences between two executions of data analysis scripts. Aardvark traces two consecutive instances of an analysis script, identifies the differences between them, and presents them through comparative visualizations. We present a prototype implementation in Python as well as an extension to support scripts in Jupyter notebooks. Finally, to demonstrate Aardvark, we provide two usage scenarios on real world analysis scripts.
Recommended citation: R. Faust, C. Scheidegger, and C. North, “Aardvark: Comparative Visualization of Data Analysis Scripts.” Symposium on Visualization in Data Science (VDS) at IEEE VIS, 2023