Explainable Interactive Projections for Image Data
Published in International Symposium on Visual Computing, 2022
A list of all the posts and pages found on the site. For you robots out there is an XML version available for digesting as well.
Published in International Symposium on Visual Computing, 2022
Page not found. Your pixels are in another canvas.
This is a page not in th emain menu
Undergraduate course, University of Arizona, Computer Science Department, 2020
Published:
This post will show up by default. To disable scheduling of future posts, edit config.yml and set future: false.
Published:
This is a sample blog post. Lorem ipsum I can’t remember the rest of lorem ipsum and don’t have an internet connection right now. Testing testing testing this blog post. Blog posts are cool.
Published:
This is a sample blog post. Lorem ipsum I can’t remember the rest of lorem ipsum and don’t have an internet connection right now. Testing testing testing this blog post. Blog posts are cool.
Published:
This is a sample blog post. Lorem ipsum I can’t remember the rest of lorem ipsum and don’t have an internet connection right now. Testing testing testing this blog post. Blog posts are cool.
Published:
This is a sample blog post. Lorem ipsum I can’t remember the rest of lorem ipsum and don’t have an internet connection right now. Testing testing testing this blog post. Blog posts are cool.
Published:
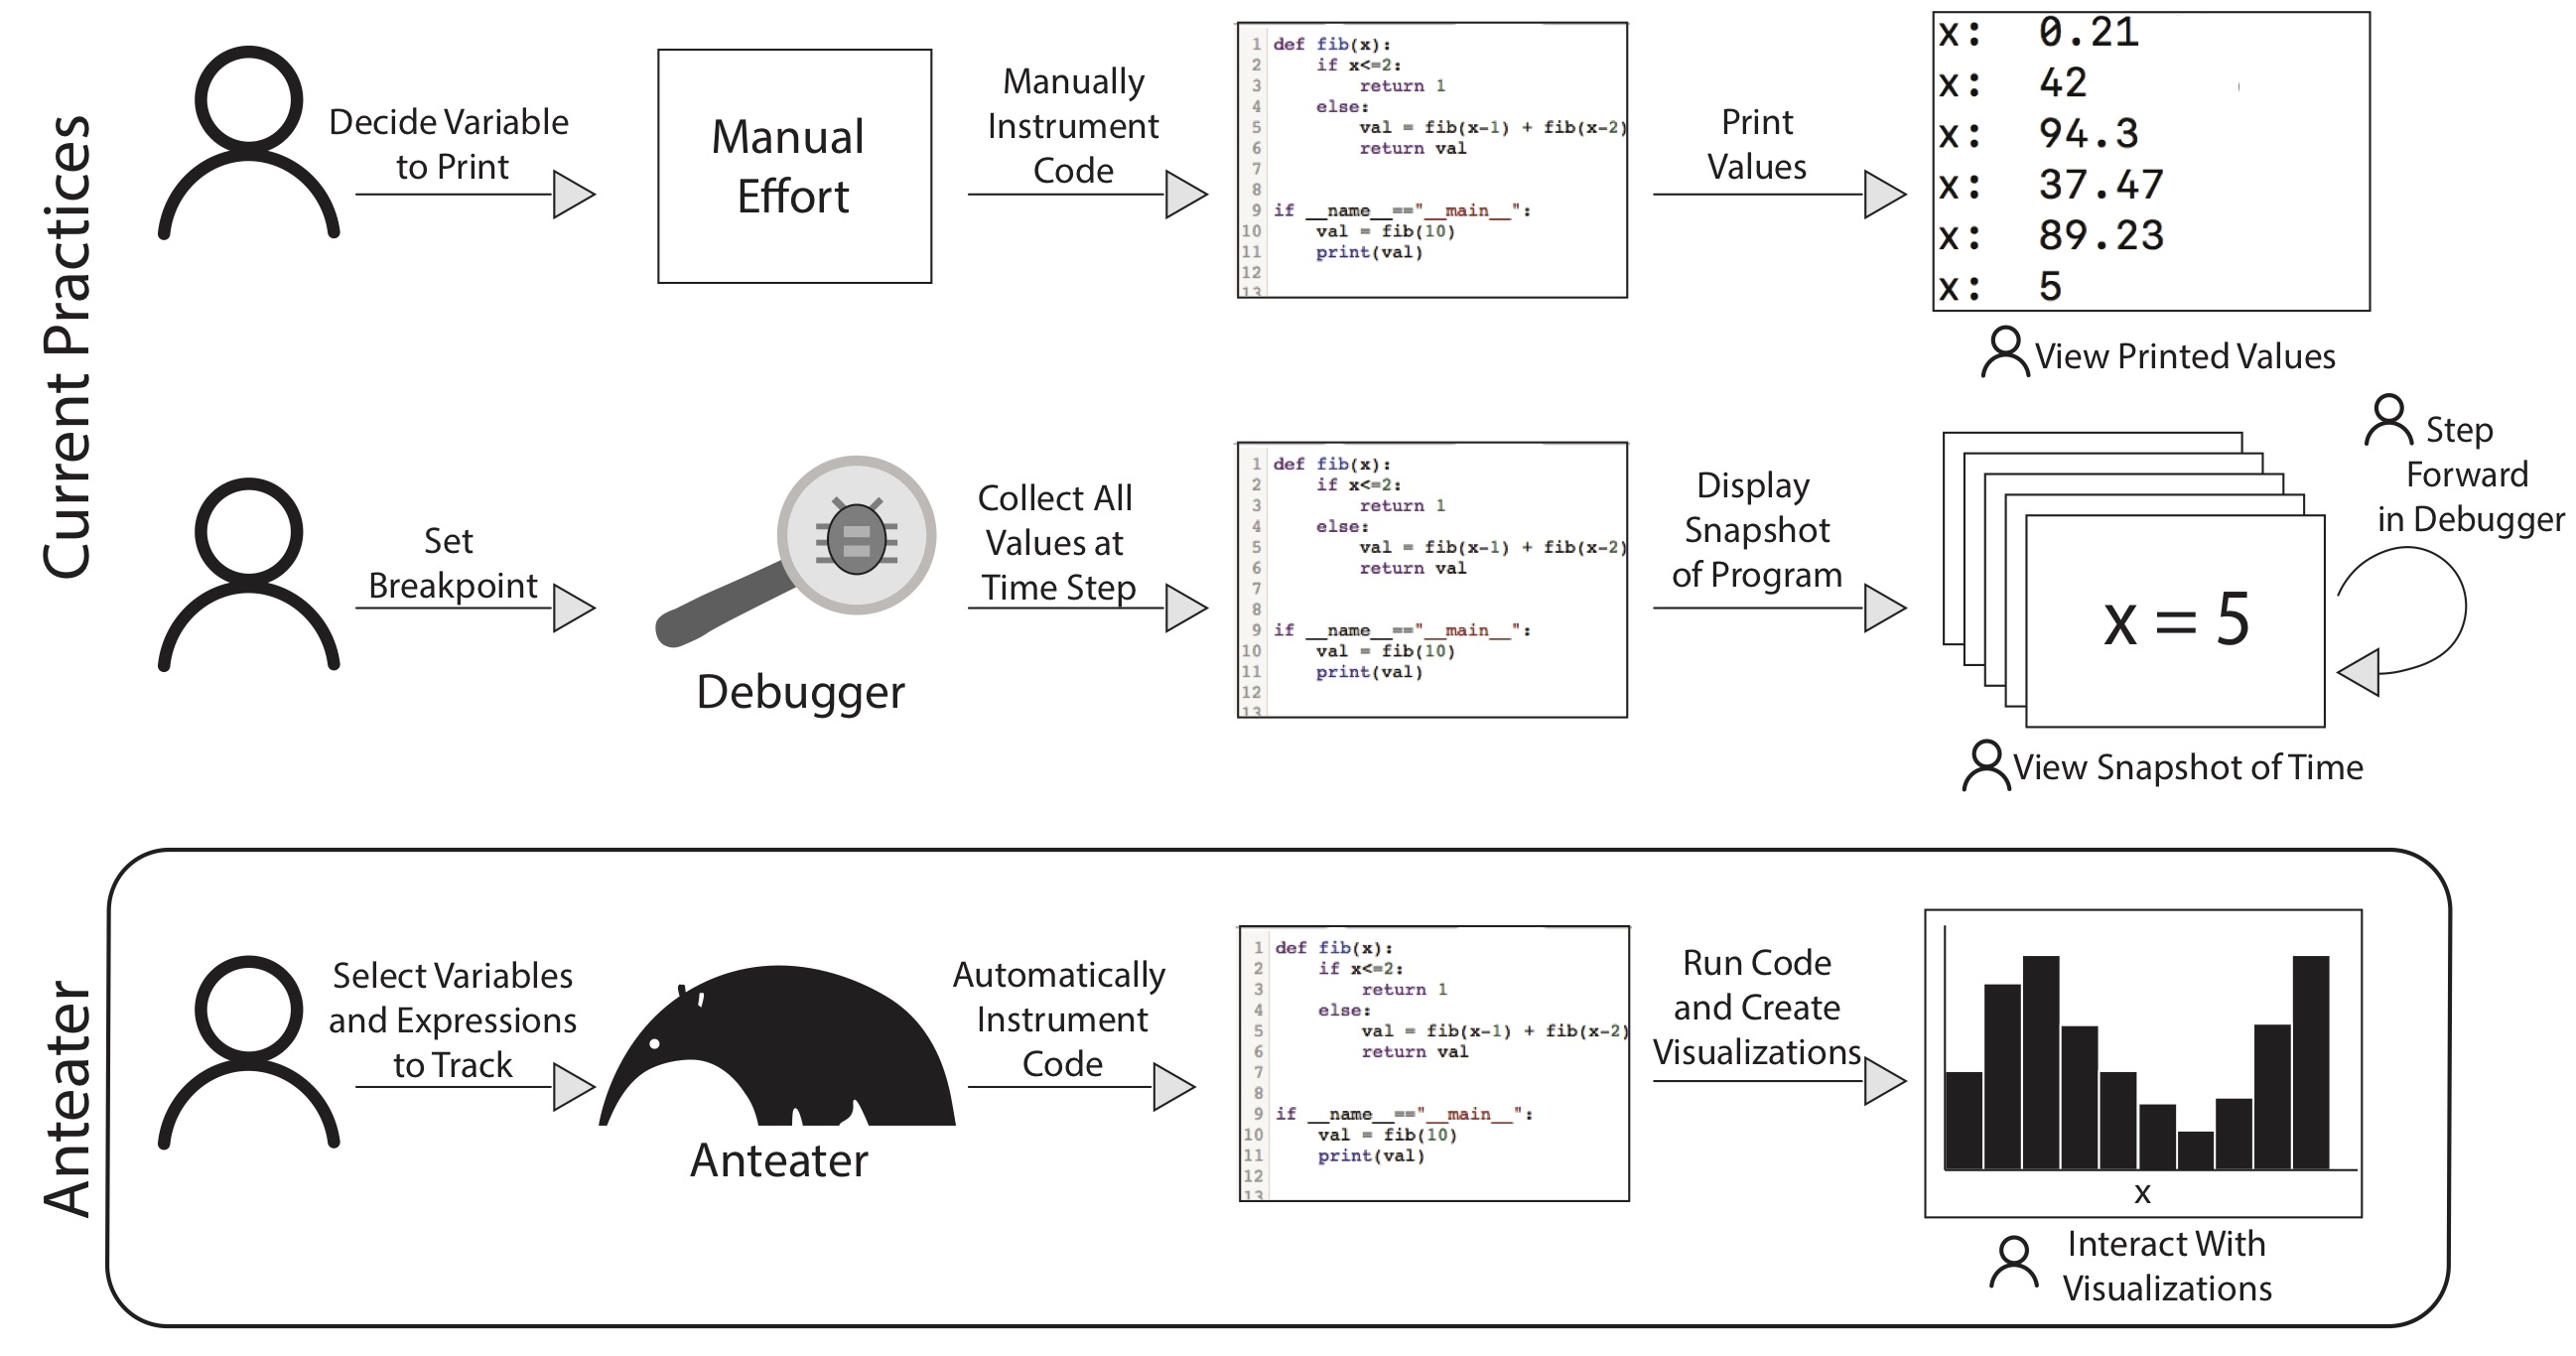
Anteater is an interactive visualization system for tracing and exploring the execution of a program. It alleviates the burden of manual instrumentation by automatically instrumenting source code to track the values that the user desires to inspect, along with the execution trace. Anteater presents the trace to users through various visualizations. 
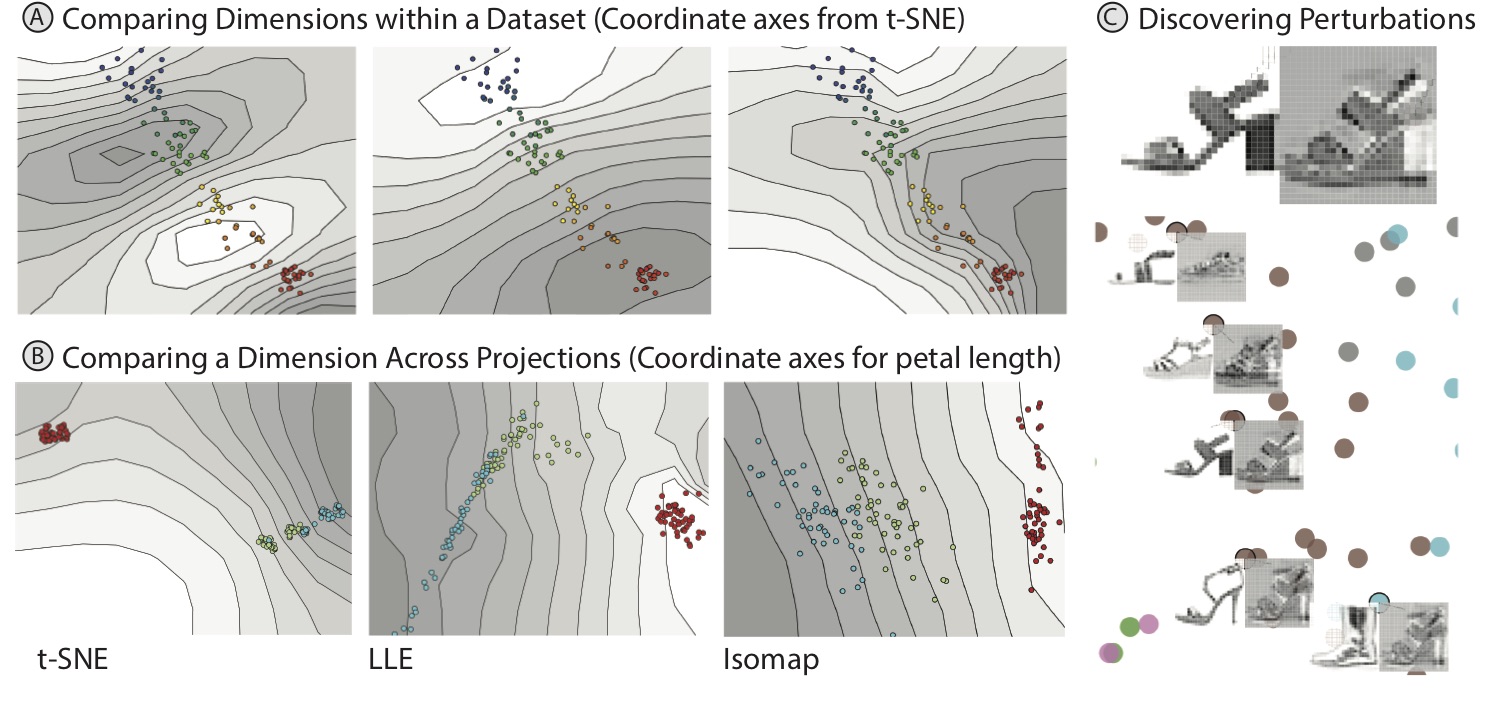
DimReader is a technique that recovers readable axes from dimensionality reduction techniques. It analyzes infinitesimal perturbations of the dataset with respect to variables of interest. The recovered axes are in direct analogy with the axis lines (grid lines) of traditional scatterplots. DimReader also provides methods for discovering the perturbations on the input data that change the projection the most. 
Published in IEEE Trans. on Visualization and Computer Graphics 25(1) , 2018
Published in Symposium on Visual Data Science at IEEE VIS, 2022
Published in Machine Vision and Aplications, 2023
Published in Symposium on Visual Data Science at IEEE VIS, 2023
Published:
In this talk, I present DimReader: Axis Lines that Explain Non-Linear Projections. DimReader is a technique that recovers readable axes from dimensionality reduction techniques by analyzing infinitesimal perturbations of the dataset with respect to variables of interest. This talk was presented at IEEE VIS 2018.
Undergraduate course, University of Arizona, Computer Science Department, 2020
An introduction to mathematical concepts for Computer Science. Topics include first-order logic and logical arguments, proof techniques with an emphasis on mathematical induction, sets, relations and functions, properties of integers, counting methods, probability, and recurrences.
Undergraduate course, University of Arizona, Computer Science Department, 2021
An introduction to mathematical concepts for Computer Science. Topics include first-order logic and logical arguments, proof techniques with an emphasis on mathematical induction, sets, relations and functions, properties of integers, counting methods, probability, and recurrences.
Undergraduate/Graduate course, Tulane University, Computer Science Department, 2024
An introduction on how graphical representations of data can be used to aid understanding. This course details the theory and practice of designing effective information visualizations. The techniques learned in this class have wide applications to all fields in engineering and science, where due to increasing sizes and complexity, data now demands effective presentation and analysis. This course will cover the principles, methods, and techniques that are fundamental to information visualization.